Resulting plot from the previous Python API Post.

Sculpture, Machines, Bicycles, IoT, Attention Deficit Disorder
Resulting plot from the previous Python API Post.
Spent some time working with the Plotly Python API. Able to read my data logger files and upload to a plot with ease. Will need to comment code better I know…just started playing with it and wanted to share. Upload all environmental data and if the additional “Annotation” field exist add that to the plot as well.
More Info at: Plotly Python API
import plotly.plotly as py
from plotly.graph_objs import *

myname = 'plotlyid'
mykey = "plotlykey"

py.sign_in(myname,mykey)

x1 =[]
y1 =[]
y2 =[]
y3 =[]
MyAnnotation = []

f = open("LOGGER26.CSV",'r')
#f = open("smallset.csv",'r')

for lines in f:
	data = lines.split(',')
	x1.append(data[0])
	y1.append(data[1])
	y2.append(data[2])
	y3.append(data[3].strip())

	if len(data)==5:
		print data[4]
		Annotation = {'x':data[0],'y':data[1],'text':data[4] + data[0],'xref':'x','yref':'y','showarrow':True,'arrowhead':7,'bgcolor':'red'}
		MyAnnotation.append(Annotation)

# (2) Make dictionary linking x and y coordinate lists to 'x' and 'y' keys
#     (mandatory in plotly v.1.0.8 and up)
layout = Layout(
	title="MyEnvi",

	annotations=MyAnnotation,

    legend=Legend(
        x=100,
        y=1
    ),
    xaxis=XAxis(
    	domain=[0, 0.8],
        autorange=True,
        showgrid=False,
        zeroline=False,
        showline=True,
        autotick=True,
        ticks='',
        showticklabels=True
    ),
    yaxis=YAxis(
    	title="Light",
    	autorange=True,
        showgrid=False,
        zeroline=False,
        showline=True,
        autotick=True,
        ticks='',
        showticklabels=True
    ),

    yaxis2=YAxis(
        title='Barometric',
        showgrid=False,
        titlefont=Font(
            color='#ff7f0e'
        ),
        tickfont=Font(
            color='#ff7f0e'
        ),
        anchor='x',
        overlaying='y',
        side='right'

    ),

 	yaxis3=YAxis(
 		showgrid=False,
        title='Temp',
        titlefont=Font(
            color='#087804'
        ),
        tickfont=Font(
            color='#087804'
        ),
        anchor='free',
        overlaying='y',
        side='right',
        position = .9
    ),

)
trace1 = dict(x=x1,y=y1, name='Light')
trace2 = dict(x=x1,y=y2, name= 'Barometric',yaxis='y2')
trace3 = dict(x=x1,y=y3, name='Temp',yaxis='y3')
# (3) Make list of 1 trace, to be sent to Plotly
#     (mandatory in 1.0.8 and up)
data = [trace1,trace2,trace3]

fig = Figure(data=data,layout=layout)

plot_url = py.plot(fig, filename='MyEnvi')
f.close()
Short data file snippet:
2014-6-10 19:19:48,508,996.00,24.94
2014-6-10 19:19:49,508,995.95,24.94
2014-6-10 19:19:50,508,995.99,24.94
2014-6-10 19:19:51,508,995.95,24.92
2014-6-10 19:19:53,507,995.93,24.92,Migraine Severe
2014-6-10 19:19:54,507,995.99,24.94
2014-6-10 19:19:55,507,995.96,24.94
2014-6-10 19:19:56,507,996.00,24.92
2014-6-10 19:19:57,507,995.98,24.94
2014-6-10 19:19:58,507,995.97,24.92
2014-6-10 19:19:59,507,995.92,24.92
2014-6-10 19:20:0,507,995.92,24.92
Next steps: Create a way to add the annotation to the data file on the Arduino.


Wanted to add a more comprehensive light monitor to my project. Tha TSL 2591 does the trick. Started running into memory issues with my Arduino Uno. Will will add that discovery and resolution in an upcoming post.

Adafruit to the rescue as I am pushing my project to be portable.
One lithium ion polymer battery and an Adafruit PowerBoost 500 Charger later I was able to get the project untethered from a power source.
Will figure out battery life and such in the near future.
Couple of interesting notes: I already went the alkaline battery route – it worked to a point but the are too bulky for my applications and they had about a 4 hour life span. The combination of Adafruits PowerBoost 500 Charger and the LiPo seems to be (so far) ideal.
The PowerBoost 500 does not work for this application (probably no application) if you connect it via the 2.1mm Power Jack. The Power Jack needs at least 6V to operate properly. I have not yet evaluated using the USB power input. My initial finding showed that it did not work but I am a bit skeptical about my USB connection. Does not really matter much as I know have the PowerBoost 500 connected right to GND and VIN which works great!
Further reading on the subject it appears the only way to power the Arduino from the PowerBoost 500 is the way I ended up doing it — straight to GND and VIN. Makes sense as the USB optional output appears to be for charging other units, not powering a device.

Used the Adafruit Data Logger prototype area. A little sloppy but working. Need to move the BMP180 next time as I realized the pins interfer with the Uno ATmega chip.
Next steps: figure out power and a simple enclosure.
Updated the Fritzing diagram to mostly match the project. There does not appear to be an Adafruit Data Logging part for Fritzing yet and the Barometric sensor has not been updated to the BMP180 (but 85 close enough).

I just used Fritzing for the first time and was quite impressed. Will help me a lot as I dissect what I built already and as I design new projects moving forward. I have only scratched the surface using Fritzing application but it is great.

I have played with a few IOT type services for showing off data collected and or sent from Arduino (and other micro controller devices) and have settled on Plot.ly for now.
I have used ThingSpeak and Xively as well but found Plotly worked better for importing from the data logger disk than the others. Xively appear to be more “live update” oriented and not as well geared for file upload of large data sets.


New soldering station “Sparkfun 937b”..a cheap RadioShack board to practice my old soldering skills..an Adafruit datalogger and BMP pressure sensor…tah dah.
Adafruit:
Local MicroCenter had the Spackfun 937B so I grabbed it from there. Works really well, agree with most reviews on the holder (it sucks) but had not problem soldering the headers for the Data Logging shield and the BMP180.
Next steps…use plotly to show results from the logger.


Stumbled on this GE Garage on Connecticut Ave. Nicely appointed with lots of 3D printers, a laser cutter, cnc mill and more…
Made the aluminum base mate to the one I did for the Uno for the breadboard. Makes for a much more stable breadboard.


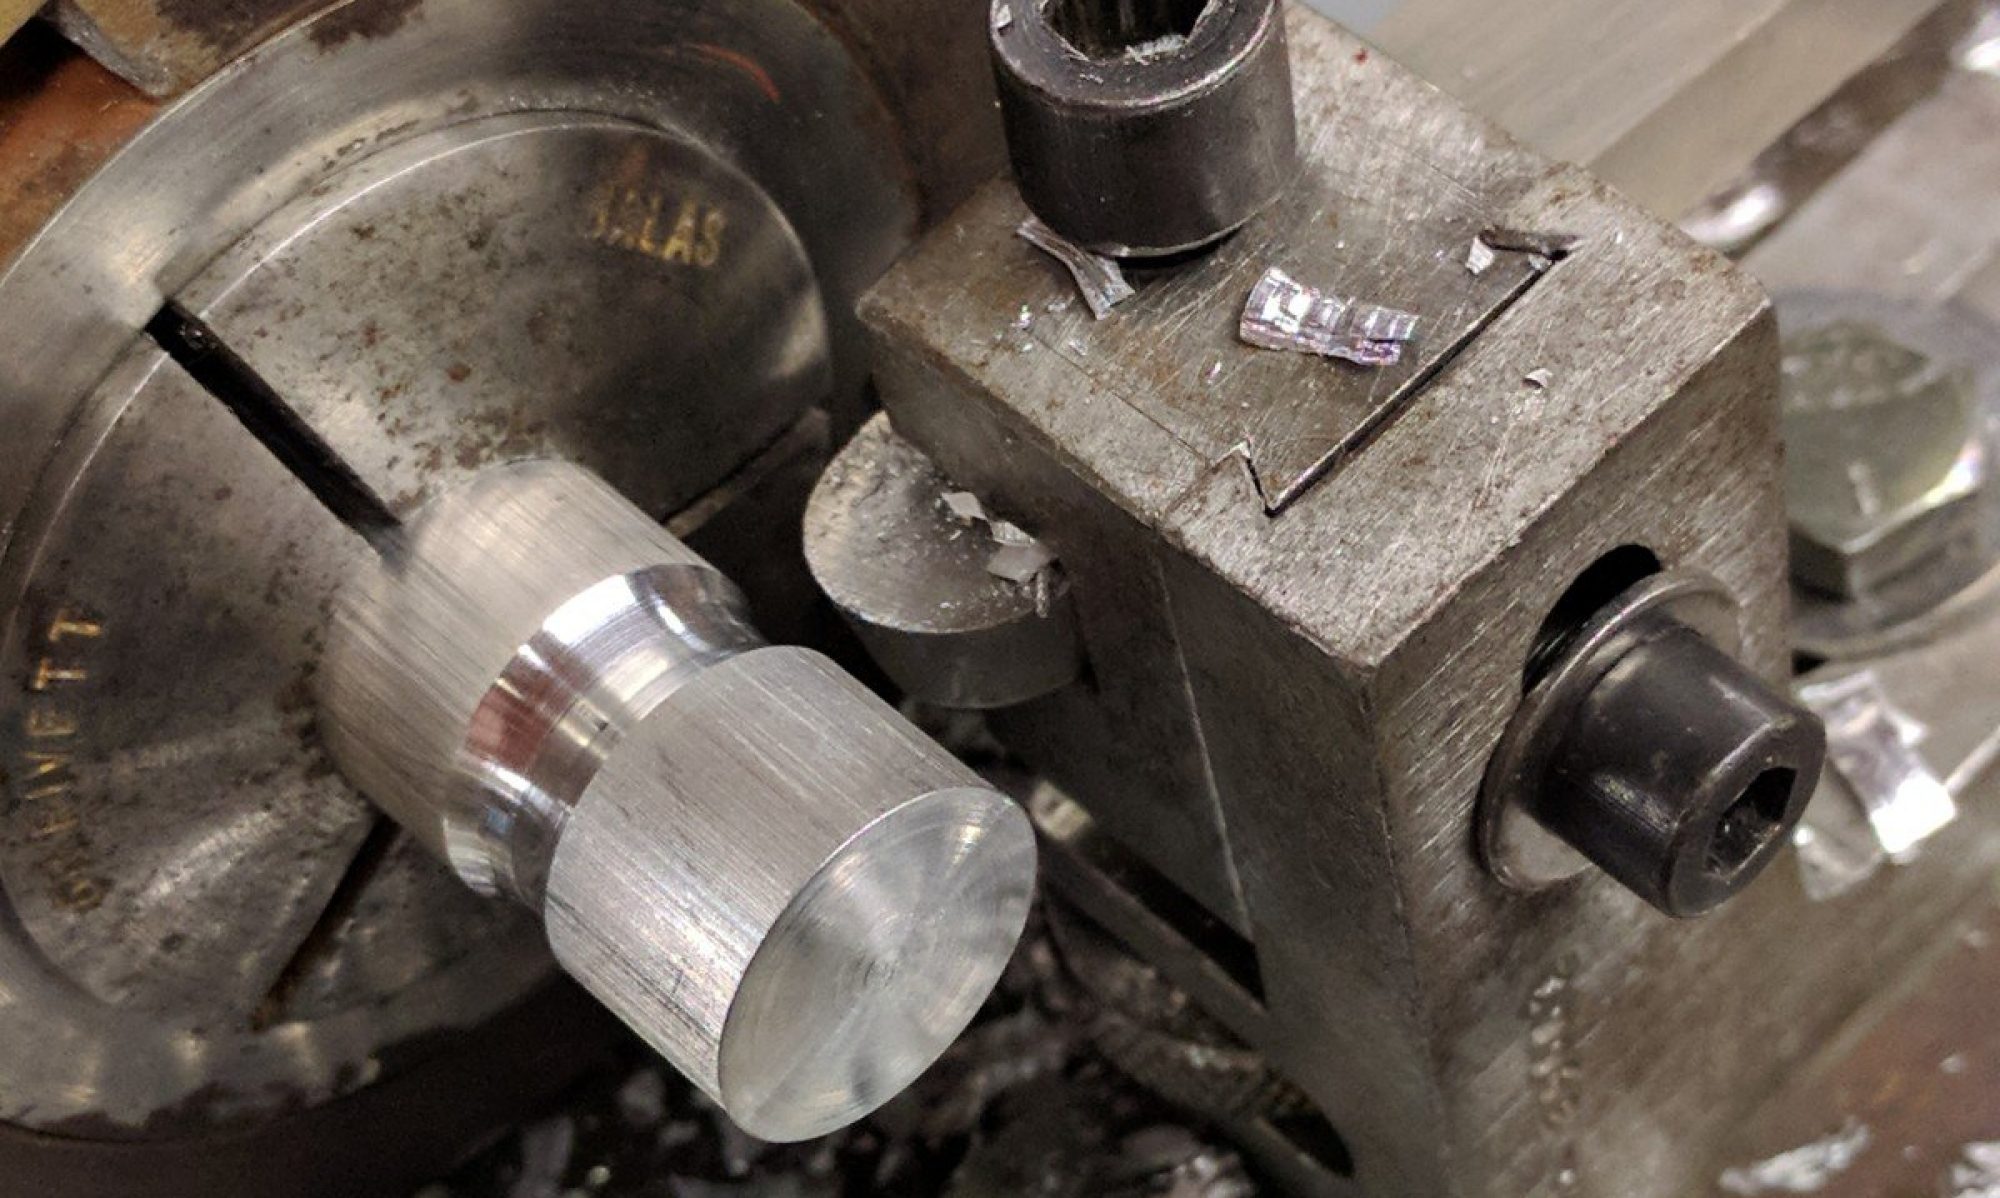
Finished base after using fly cutter to do the final finish passes and a few quick runs on the disk sander.

This side as way off as I messed up the cut in the hacksaw. Ran a roughing mill to get it close and now ready for the fly cutter.

Roughing mill pass.

Initial cut on hacksaw got away from me – fixed later with roughing mill.

Fly cutter – pre cut. Actually our of sequence but used this tool later to finish of the block.

Power Hack Saw! Love this machine.

Aluminum block from the scrap pile. Came off a big discarded injection mold.